What is Japan’s ODA (Official Development Assistance)?
Japan’s Official Development Assistance
Official Development Assistance (ODA) refers to grants and loans with concessional conditions that are given to developing countries and regions that are included on the list of aid recipient countries and regions created by the Development Assistance Committee (DAC) of the Organization for Economic Co-operation and Development (OECD), mainly for the purpose of contributing to the improvement of economic development and welfare, etc.
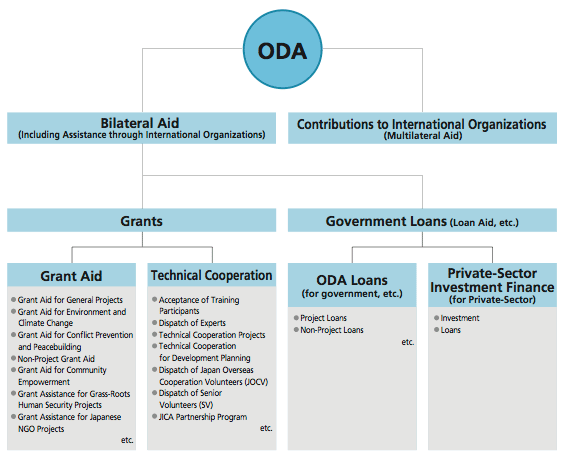
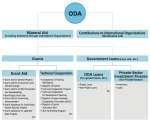
ODA consists of bilateral aid, which is used to support developing countries directly, and multilateral aid, which is support provided through international organizations. Bilateral aid can be divided into two categories: grants and government loans. Grants are cooperation that is provided to developing countries without repayment. There are two types: grant aid and technical cooperation. Grants include contributions to specific projects implemented by international organizations. On the other hand, government loans are given on the assumption that the developing country will repay the loan in the future. Project loans refer to loans to specific projects implemented by governments of developing countries to develop socio—economic infrastructure such as roads, power plants, and irrigation facilities. Non-project loans refer to loans for assistance in improvement of policies and institutions of developing countries rather than loans to specific projects. In addition, Private-Sector Investment Finance, which provides the loans or investment for private-sector companies that implement projects in developing countries, restarted full-fledgedly in October 2012. Multilateral aid includes contributions to the United Nations Children’s Fund (UNICEF) and the United Nations Development Programme (UNDP), contributions and subscriptions to the World Bank, etc.
List of ODA Recipient Countries (1960-2012)
| Region | Country | Year | Total |
| East Asia | South Korea | 1960-2009 | $278,150,000 |
| China | 1979-2012 | $19,456,010,000 | |
| Hong Kong | 1969-2012 | $92,630,000 | |
| Macau | 1979-2008 | $2,640,000 | |
| Mongolia | 1985-2012 | $1,623,720,000 | |
| Indonesia | 1969-2012 | $18,245,600,000 | |
| Cambodia | 1969-2012 | $2,146,860,000 | |
| Singapore | 1969-2012 | $217,830,000 | |
| Thai | 1969-2012 | $5,753,940,000 | |
| East Timor | 1974-2012 | $242,830,000 | |
| Philippines | 1969-2012 | $9,899,960,000 | |
| Brunei | 1974-2012 | $45,560,000 | |
| Vietnam | 1969-2012 | $12,152,510,000 | |
| Malaysia | 1969-2012 | $2,741,720,000 | |
| Myanmar | 1969-2012 | $3,264,400,000 | |
| Laos | 1969-2012 | $1,804,500,000 | |
| Multiple Countries | 1973-2012 | $414,290,000 | |
| South Asia | India | 1969-2012 | $12,461,990,000 |
| Sri Lanka | 1969-2012 | $5,032,430,000 | |
| Nepal | 1969-2012 | $2,296,460,000 | |
| Pakistan | 1969-2012 | $6,673,930,000 | |
| Bangladesh | 1972-2012 | $5,735,530,000 | |
| Bhutan | 1969-2012 | $470,640,000 | |
| Maldives | 1970-2012 | $320,820,000 | |
| Multiple Countries | 1969-2012 | $30,960,000 | |
| Middle Asia & Caucasus | Azerbaijan | 1992-2012 | $654,910,000 |
| Armenia | 1994-2012 | $390,610,000 | |
| Uzbekistan | 1992-2012 | $825,740,000 | |
| Kazakhstan | 1992-2012 | $817,140,000 | |
| Kyrgyzstan | 1992-2012 | $535,450,000 | |
| Georgia | 1994-2012 | $174,490,000 | |
| Tajikistan | 1992-2012 | $221,890,000 | |
| Turkmenistan | 1992-2012 | $39,220,000 | |
| Multiple Countries | 2007-2012 | $12,950,000 | |
| Middle East & North Africa | Afghanistan | 1969-2012 | $3,563,780,000 |
| United Arab Emirates | 1972-2012 | $33,040,000 | |
| Algeria | 1969-2012 | $52,080,000 | |
| Yemen | 1969-2012 | $830,180,000 | |
| Israel | 1970-2012 | $17,270,000 | |
| Iraq | 1969-2012 | $8,673,890,000 | |
| Iran | 1969-2012 | $372,630,000 | |
| Egypt | 1969-2012 | $3,454,220,000 | |
| Oman | 1975-2012 | $132,730,000 | |
| Qatar | 1970-2012 | $10,750,000 | |
| Kuwait | 1969-2012 | $11,830,000 | |
| Saudi Arabia | 1969-2012 | $44,960,000 | |
| Syria | 1969-2012 | $877,400,000 | |
| Tunisia | 1974-2012 | $812,740,000 | |
| Turkey | 1969-2012 | $2,613,280,000 | |
| Bahrain | 1974-2012 | $18,500,000 | |
| Palestinian National Authority | 1993-2012 | $735,660,000 | |
| Morocco | 1969-2012 | $1,549,430,000 | |
| Jordan | 1969-2012 | $1,525,110,000 | |
| Libya | 1970-2012 | $13,180,000 | |
| Lebanon | 1969-2012 | $116,710,000 | |
| Multiple Countries | 1969-2012 | $111,730,000 | |
| Sub-Saharan Africa & Aflica | Angola | 1978-2012 | $337,410,000 |
| Uganda | 1969-2012 | $746,090,000 | |
| Ethiopia | 1969-2012 | $1,237,920,000 | |
| Eritrea | 1994-2012 | $125,680,000 | |
| Ghana | 1969-2012 | $2,110,680,000 | |
| Cape Verde | 1980-2012 | $190,000,000 | |
| Gabon | 1969-2012 | $72,320,000 | |
| Cameroon | 1970-2012 | $378,520,000 | |
| Gambia | 1977-2012 | $163,020,000 | |
| Guinea | 1970-2012 | $548,150,000 | |
| Guinea-Bissau | 1969-2012 | $122,850,000 | |
| Kenya | 1969-2012 | $2,539,220,000 | |
| Cote d’Ivoire | 1969-2012 | $703,830,000 | |
| Comoros | 1980-2012 | $62,220,000 | |
| Congo | 1975-2012 | $46,910,000 | |
| Democratic Republic of the Congo | 1969-2012 | $1,363,920,000 | |
| São Tomé and Príncipe | 1981-2012 | $57,230,000 | |
| Zambia | 1970-2012 | $1,814,720,000 | |
| Sierra Leone | 1976-2012 | $280,270,000 | |
| Djibouti | 1978-2012 | $306,060,000 | |
| Zimbabwe | 1980-2012 | $761,680,000 | |
| Sudan | 1969-2012 | $94,600,000 | |
| Swaziland | 1971-2012 | $149,750,000 | |
| Seychelles | 1978-2012 | $61,420,000 | |
| Equatorial Guinea | 1983-2012 | $11,640,000 | |
| Senegal | 1969-2012 | $1,326,530,000 | |
| Saint Helena | 1989-2012 | $650,000 | |
| Somalia | 1969-2012 | $310,260,000 | |
| Tanzania | 1969-2012 | $3,330,760,000 | |
| Chad | 1978-2012 | $107,120,000 | |
| Central African Republic | 1971-2012 | $378,090,000 | |
| Togo | 1972-2012 | $240,590,000 | |
| Nigeria | 1969-2012 | $2,427,700,000 | |
| Namibia | 1990-2012 | $199,330,000 | |
| Niger | 1971-2012 | $618,250,000 | |
| Burkina Faso | 1973-2012 | $477,650,000 | |
| Burundi | 1972-2012 | $263,160,000 | |
| Benin | 1972-2012 | $402,390,000 | |
| Botswana | 1976-2012 | $139,470,000 | |
| Madagascar | 1969-2012 | $933,110,000 | |
| Malawi | 1971-2012 | $1,047,890,000 | |
| Mali | 1975-2012 | $638,110,000 | |
| South Africa | 1991-2012 | $240,310,000 | |
| South Sudan | 2011-2012 | $100,590,000 | |
| Mauritius | 1976-2012 | $103,380,000 | |
| Mauritania | 1974-2012 | $545,020,000 | |
| Mozambique | 1975-2012 | $1,071,280,000 | |
| Liberia | 1972-2012 | $352,330,000 | |
| Rwanda | 1970-2012 | $335,820,000 | |
| Lesotho | 1976-2012 | $112,600,000 | |
| Réunion | 1984-1992 | $60,000 | |
| Multiple Countries | 1972-2012 | $1,048,140,000 | |
| Latin America | Argentina | 1969-2012 | $588,940,000 |
| Aruba | 1997 | $10,000 | |
| Antigua and Barbuda | 1982-2012 | $55,350,000 | |
| Uruguay | 1970-2012 | $150,560,000 | |
| Ecuador | 1969-2012 | $482,960,000 | |
| El Salvador | 1969-2012 | $656,100,000 | |
| Guyana | 1974-2012 | $115,920,000 | |
| Cuba | 1970-2012 | $68,950,000 | |
| Guatemala | 1969-2012 | $784,370,000 | |
| Guadeloupe | 1983-1992 | $40,000 | |
| Grenada | 1978-2012 | $59,020,000 | |
| Cayman Islands | 1980 | $10,000 | |
| Costa Rica | 1969-2012 | $308,880,000 | |
| Colombia | 1969-2012 | $288,260,000 | |
| Jamaica | 1974-2012 | $84,990,000 | |
| Suriname | 1974-2012 | $44,110,000 | |
| Saint Kitts and Nevis | 1984-2012 | $18,110,000 | |
| Saint Vincent | 1983-2012 | $64,070,000 | |
| Saint Lucia | 1980-2012 | $78,810,000 | |
| Chile | 1969-2012 | $460,890,000 | |
| Dominican Republic | 1969-2012 | $486,280,000 | |
| Dominica | 1979-2012 | $77,050,000 | |
| Trinidad and Tobago | 1969-2012 | $31,320,000 | |
| Nicaragua | 1970-2012 | $948,850,000 | |
| Haiti | 1976-2012 | $327,030,000 | |
| Panama | 1969-2012 | $509,190,000 | |
| Bahamas | 1976-2007 | $560,000 | |
| Bermuda | 1982-1985 | $20,000 | |
| Paraguay | 1969-2012 | $1,079,740,000 | |
| Barbados | 1977-2012 | $10,040,000 | |
| French Guiana | 1980-1992 | - $240,000 | |
| Brazil | 1969-2012 | $1,782,300,000 | |
| Venezuela | 1969-2012 | $118,700,000 | |
| Belize | 1984-2012 | $24,710,000 | |
| Peru | 1969-2012 | $1,596,120,000 | |
| Bolivia | 1969-2012 | $1,731,220,000 | |
| Honduras | 1969-2012 | $1,440,550,000 | |
| Martinique | 1976, 1983 | $20,000 | |
| Mexico | 1969-2012 | $850,910,000 | |
| Montserrat | 1980-2005 | $450,000 | |
| Nederlandse Antillen | 1977-1998 | $140,000 | |
| Multiple Countries | 1971-2012 | $190,420,000 | |
| Oceania | Northern Mariana Islands | 1990-1996 | - $970,000 |
| Kiribati | 1974-2012 | $208,830,000 | |
| Cook Islands | 1981-2012 | $9,280,000 | |
| Samoa | 1972-2012 | $347,500,000 | |
| Solomon Islands | 1972-2012 | $290,650,000 | |
| Tuvalu | 1981-2012 | $91,910,000 | |
| Tokelau | 2012 | $10,000 | |
| Tonga | 1973-2012 | $239,810,000 | |
| Nauru | 1981-2012 | $21,780,000 | |
| Niue | 1985-2012 | $1,500,000 | |
| New Caledonia | 1975-2012 | $1,680,000 | |
| Vanuatu | 1977-2012 | $167,160,000 | |
| Papua New Guinea | 1969-2012 | $633,590,000 | |
| Palau | 1990-2012 | $205,750,000 | |
| Fiji | 1972-2012 | $414,250,000 | |
| French Polynesia | 1980-2012 | $1,580,000 | |
| United States Minor Outlying Islands | 1973-2000 | $148,900,000 | |
| Marshall Islands | 1990-2012 | $143,630,000 | |
| Federated States of Micronesia | 1990-2012 | $248,630,000 | |
| Wallis and Futuna | 1992-2012 | $200,000 | |
| Multiple Countries | 1971-2012 | $163,880,000 | |
| European Union | Albania | 1990-2012 | $104,700,000 |
| Ukraine | 2005-2012 | $257,660,000 | |
| Estonia | 2005-2012 | $1,660,000 | |
| Cyprus | 1973-2012 | $2,500,000 | |
| Greece | 1973-2012 | $7,780,000 | |
| Croatia | 1995-2012 | $14,620,000 | |
| Kosovo | 2009-2012 | $11,030,000 | |
| Spain | 1969-1982 | $1,570,000 | |
| Slovenia | 1995-2012 | $1,760,000 | |
| Serbia | 1995-2012 | $219,840,000 | |
| Belarus | 2005-2012 | $4,250,000 | |
| Bosnia and Herzegovina | 1996-2012 | $337,950,000 | |
| Portugal | 1978-1991 | $3,270,000 | |
| Republic of Macedonia | 1995-2014 | $214,780,000 | |
| Malta | 1970-2012 | $4,570,000 | |
| Moldova | 1997-2012 | $69,550,000 | |
| Montenegro | 2006-2012 | $15,130,000 | |
| Latvia | 2005-2012 | $1,450,000 | |
| Lithuania | 2005-2012 | $2,560,000 | |
| Yugoslavia | 1969-2012 | $890,590,000 | |
| Multiple Countries | 1971-2012 | $154,470,000 | |
| Eastern Europe | Slovakia | 1993-2011 | $88,620,000 |
| Czech Republic | 1993-2011 | $25,920,000 | |
| Hungary | 1990-2012 | $115,750,000 | |
| Bulgaria | 1990-2012 | $392,200,000 | |
| Poland | 1990-2011 | $534,210,000 | |
| Romania | 1990-2012 | $725,240,000 | |
| Multiple Countries | 1991-2012 | $13,090,000 |
Source:
- http://www.mofa.go.jp/policy/oda/
- http://www.mofa.go.jp/mofaj/gaiko/oda/
Related Article: